
This is officially the first blog from Zooentropy!
On March 27th, 2022, I attended the 66th Annual Primates Kenkyukai (Conference) to officially launch Zooentropy to the world.
Well, to Inuyama, and our extended primatology community, at least.
Hosted by a zoological organization, the meeting had its fair share of talks about zoo animals, their behavior and physiology, their welfare, but also some updates on the results of visitor surveys and a study or two from the wild.
What is really impressive each year is that school kids are encouraged to present at this venue! We had plenty of talks by high school students, but also one each from a team of Jr. High School students and even a 4th grader in elementary school!
I thanked her for her thoughtful talk on the ring-tailed lemurs at Japan Monkey Centre, and congratulated her on the skillful artistic impression of her study species on her title slide.
Maybe it should be automatic for scientists to showcase their own representations of their study subjects when they speak…
Scary thought! We’d end up with all kinds of things like this…
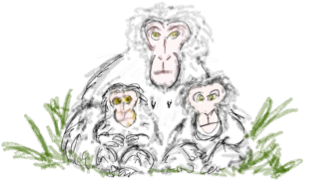
I don’t think I got the baby schema right on this one.
The Lightning Talk
Anyway, I delivered a 5-minute lightning talk (I submitted my abstract too late and there were no more slots available for a regular presentation), so I tried to pack a bunch of stuff on chaos theory, complex adaptive systems and behavioral barcodes into a short talk about animal welfare tracking.
I was pleased to have finished before the final buzzer, but it remains to be seen whether the talk was coherent. I was approached right afterward during a break by a couple of participants. Both left me unsure of my success.
One asked for clarification on the barcode – which I thought was the centerpiece that really pounded home the message! Nope.
The idea of the barcode comes from the fact that the behavioral time series that I have been working with for over a decade are binary, oscillating between a behavior of interest and its absence.
The graphical representation of such a binary sequence is a barcode, which then forms the fundamental unit of various downstream analytical applications. Actually, these behavioral barcodes don’t need to be binary at all – they could be multicolored rainbows that reflect the richness of behavioral diversity seen in sequences in animal behavior.
Here are a couple of representations from my talk.
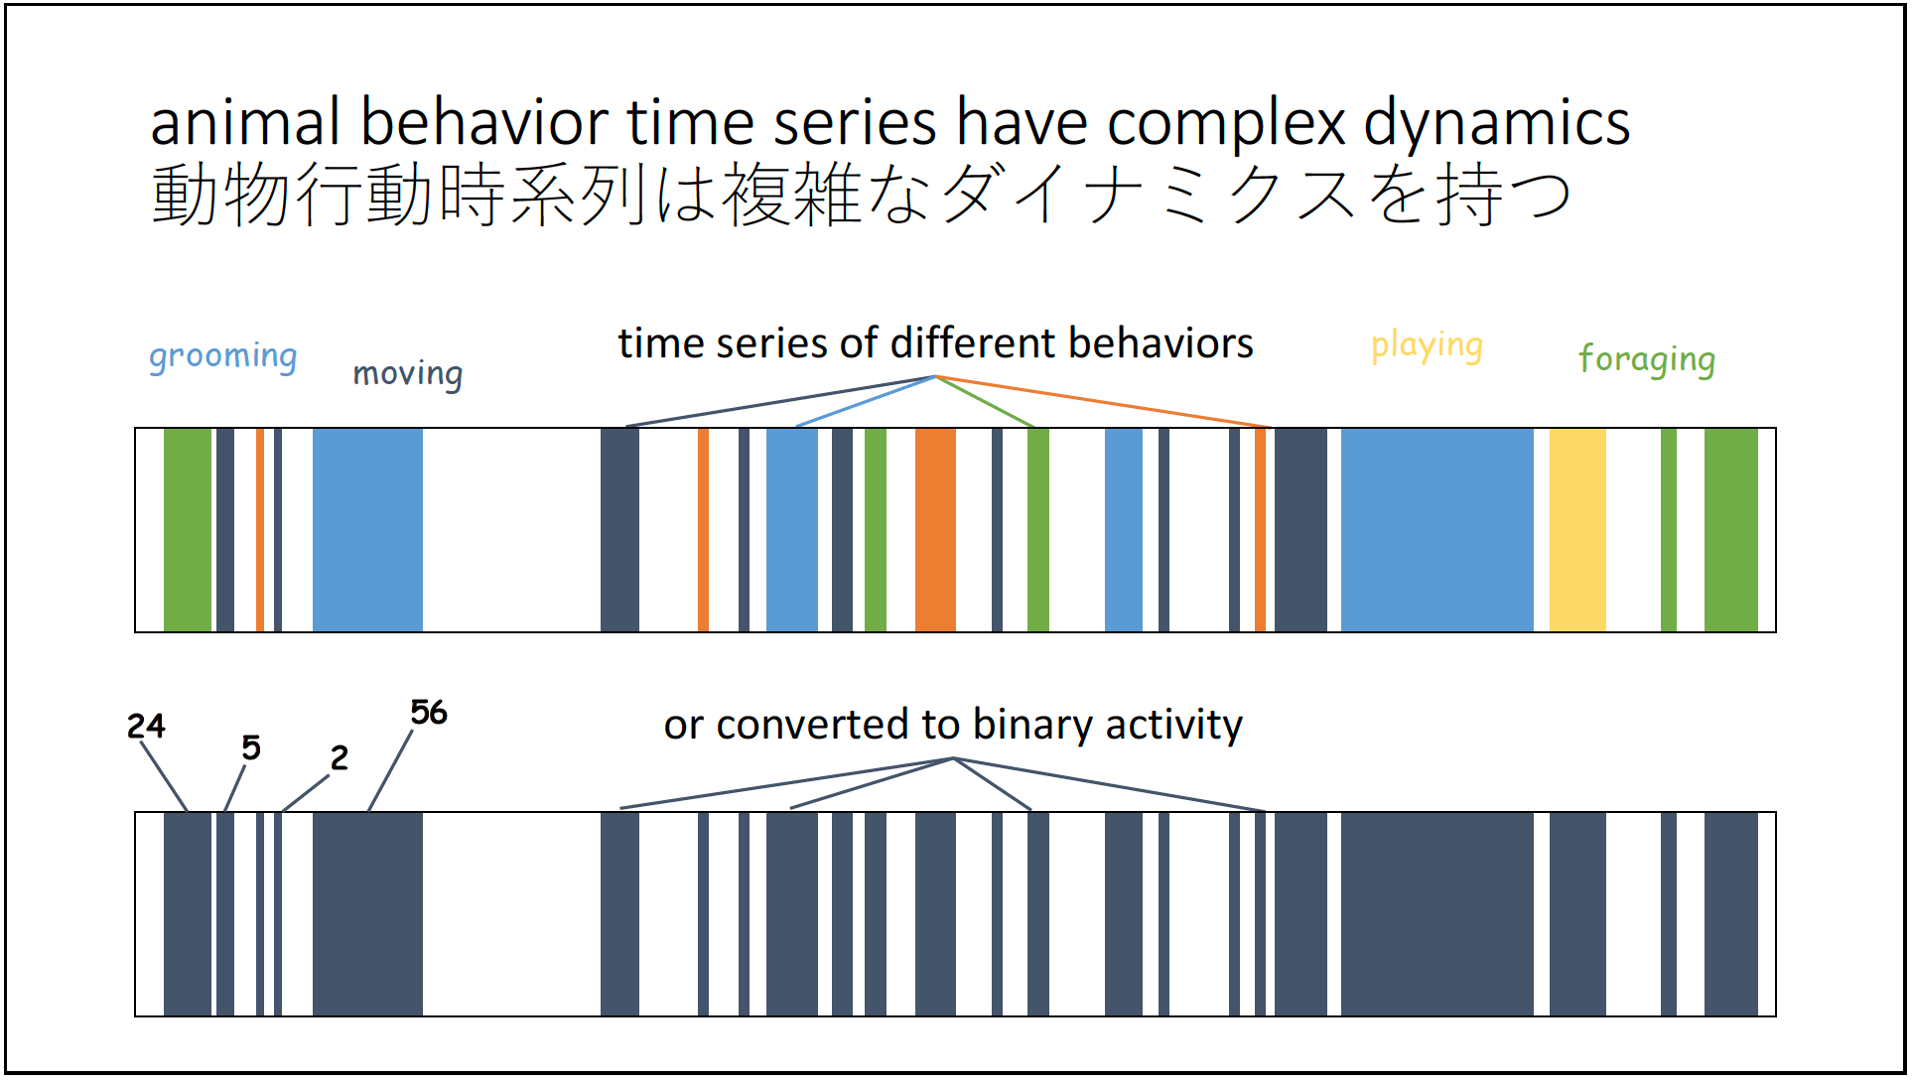
But what I think is the most useful thing about barcodes is that they are everywhere in our modern consumer lives, and everyone knows what a barcode is for – to be a unique identifier. In that sense, barcodes are very accurately representative of a specific thing.
That’s exactly what we need to identify an animal, its condition or its context from its behavior signature alone! And that’s really what this project is all about.
The second participant to approach me understood the barcode and how it related to my work, but drifted away from using the concept to protect animals into the distinct dystopian possibility that tracking of human behavior will result in personalized behavioral barcodes that can uniquely identify us remotely and (extrapolation mine) maybe even be used to predict significant events in the future based on them.
Minority Report anyone?
Then again, in various ways, I guess this is already happening.
Towards a Proof of Concept
There were two main reasons for attending this particular conference to present about Zooentropy. The first is that the Japan Monkey Centre is a major partner in this work, and so I wanted to contribute to this event they organized, not only to update partners but also as a show of support.
The second reason is that I wanted something to spur me into producing some early results for the project. I can’t spend significant amounts of time on this, so any external incentive helps push me along!
I took a specific test case to work on and spent some time coercing some data into action and producing some preliminary results.
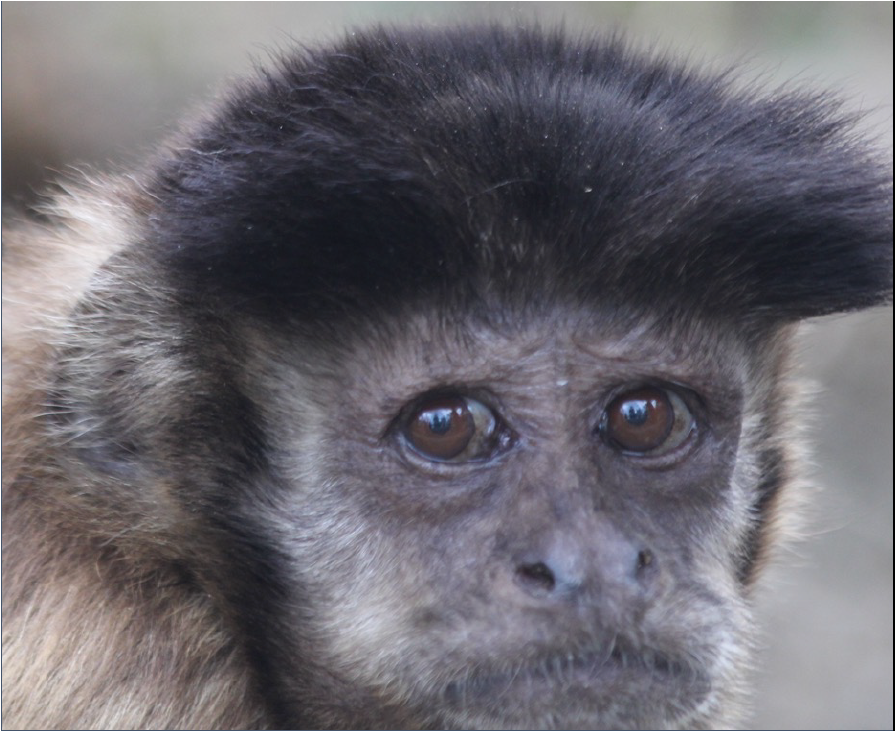
The case study is about brown capuchins (Cebus apella) at Kyoto City Zoo. Here’s a shot of one of the females in the group (Shigeko).
I traveled to Kyoto and spent three days observing this group of 7 capuchins from March 21-23. The goal was to test a few different things
The influence of a new feeding enrichment device on behavior
The influence of visitor numbers on behavior
The relationship between the performance of stereotypies and complexity in behavior sequences
The first aim did not work out. The idea was to have the first 2 days without food in the feeder, then the 3rd day with food in the feeder. Here’s what the feeder looks like, next to Peini Chen, my undergrad research assistant who was collecting data with me at the zoo.
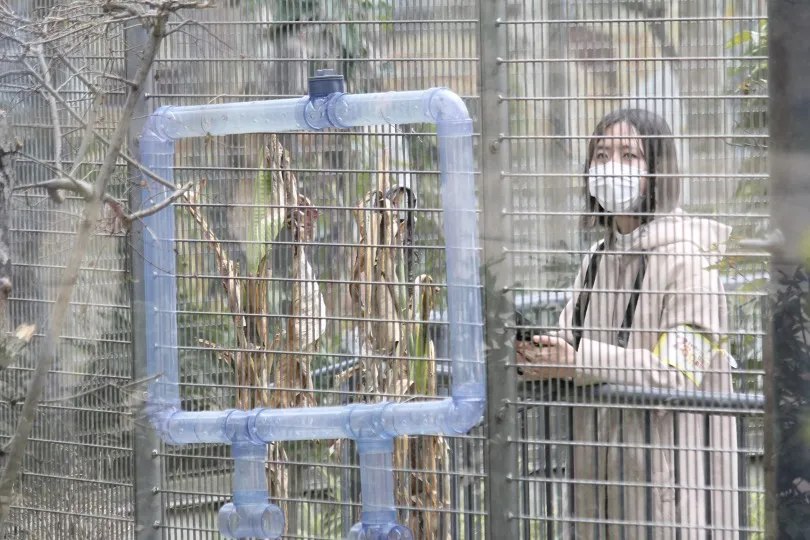
However, it turned out that, even though they lack experience, the capuchins were incredibly adept at extracting food from the device, and were done with it within minutes. We had hoped that they would be challenged and be forced to come and go for additional food between bouts of foraging on other provisions.
We’ll need a plan B.
It might still be possible to look at visitor effects. Monday, March 21, was a national holiday – the vernal equinox – so the zoo was packed! On the following day, the zoo was closed. On the final day of this particular visit, the zoo was open but it was a weekday, so visitor numbers were intermediate.
Now, obviously, this is only a 3-day sequence and cannot – even if it worked! – have been the final word. But even before that, it rained all day on March 22, which probably had an outsized effect on capuchin behavior. The experiment was, quite literally, washed out.
Groan.
But the third aim – examining behavior sequences of animals when stereotypies were frequent versus infrequent – could still be examined. In fact, I grabbed some data that had been collected over the past month and a half by Peini for good measure. And the initial results look intriguing.
To set this up, I’ll share some data here for a male brown capuchin named Kanta. First, here’s some info about the subject in a photo taken from the outside of the capuchin enclosure at Kyoto City Zoo.
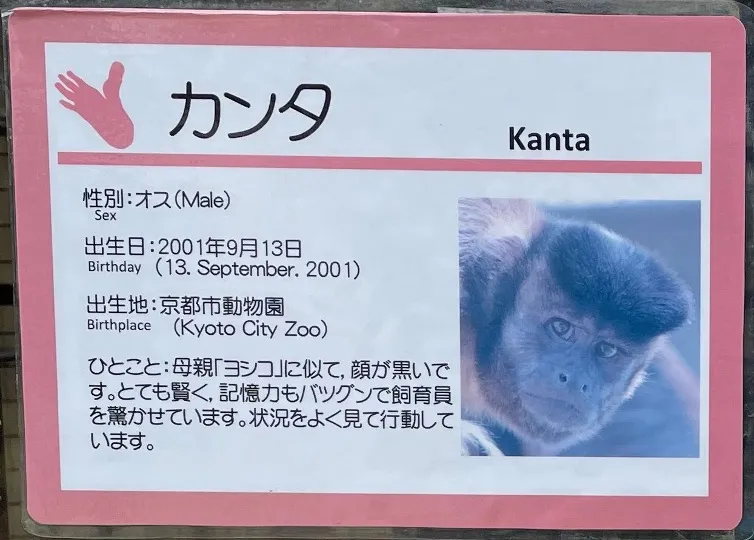
Kanta is a good test case, because he seems to perform stereotypical behavior fairly regularly, in the form of repetitive head rolls while circling the outer edge of the enclosure, about half way up on a ledge adjacent to the outer cage bars. Here is what that looks like: you can see Kanta come in about half way through toward the top left of the frame, and he performs a typical head roll as he turns the corner against the wall.
Here are a pair of example time series from behavior sequences associated with low and high numbers of stereotypical head rolls by the focal subject. The time series reflect a sequence of durations, which reset each time the capuchin changes behavior. The time series are of roughly equal length, but it’s clear that there’s a lot more variability in behavior durations in the low-stereotypy case. Next to the time series are 3D phase space plots, which plot the same time series as x=t, y=x+1, z=y+1. I hesitate to make any claims off this single example, but it’s interesting that the low-stereotypy series seems to ‘explore the space’ more extensively than the high-stereotypy case.
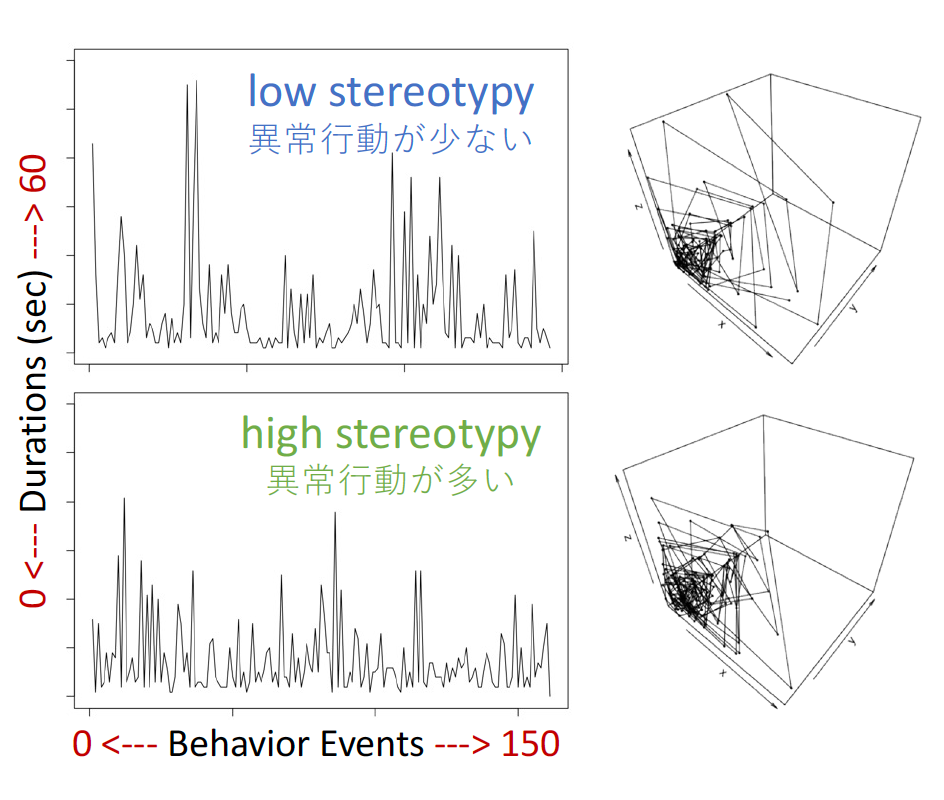
The 3D phase space plots were made according to the nonlinearTseries vignette, while the time series were plotted with the base function plot.ts().
After compiling all of Kanta’s behavior sequences and performing some analyses on them, we can also find some interesting trends emerging which support the anecdotal case above. Here, I was interested in two things: entropy of the sequence (left graph) and its degree of self-affinity or long-range autocorrelation (right graph).
The data tell a different story for long-range autocorrelation / self-affinity. Detrended Fluctuation Analysis (DFA) can be used to assess these variables in time series data. The interpretation of the values it produces – which are relatable to the classic Hurst exponents – is different than for the entropy analysis shown. For entropy, increasing values generally indicate increasing complexity, disorganization and unpredictability. In contrast, Hurst values of 0.5 reflect white noise, or true randomness in the data, whereas values departing in either direction from 0.5 indicate greater long-range autocorrelation; the key difference being that values above 0 reflect persistent long-range autocorrelation whereas values below 0 reflect antipersistent long-range autocorrelation.
It’s not indicated on the graph, unfortunately, but 0.5 occurs at the second minor gridline from the bottom, or the third gridline overall from the bottom (ignore the z-axis label here!). So, there are 2 values that reflect antipersistence – one with few stereotypies, one with the most – 2 values almost exactly at 0.5 (purely random), and a bunch around 0.6 and above.
There is another way to interpret these results, however, if the Hurst values (H) are related to the fractal dimension (D). In general, D=2-H, so the lower the H, the higher the D. Fractal Dimension was popularized by Benoit Mandelbrot as he developed the field of fractal geometry, and it’s typically thought of as a measure of roughness. So, the results here then suggest that increasing stereotypy in a sequence of behavior is associated with greater roughness.
In that sense, the results of these two analyses appear to be complementary.
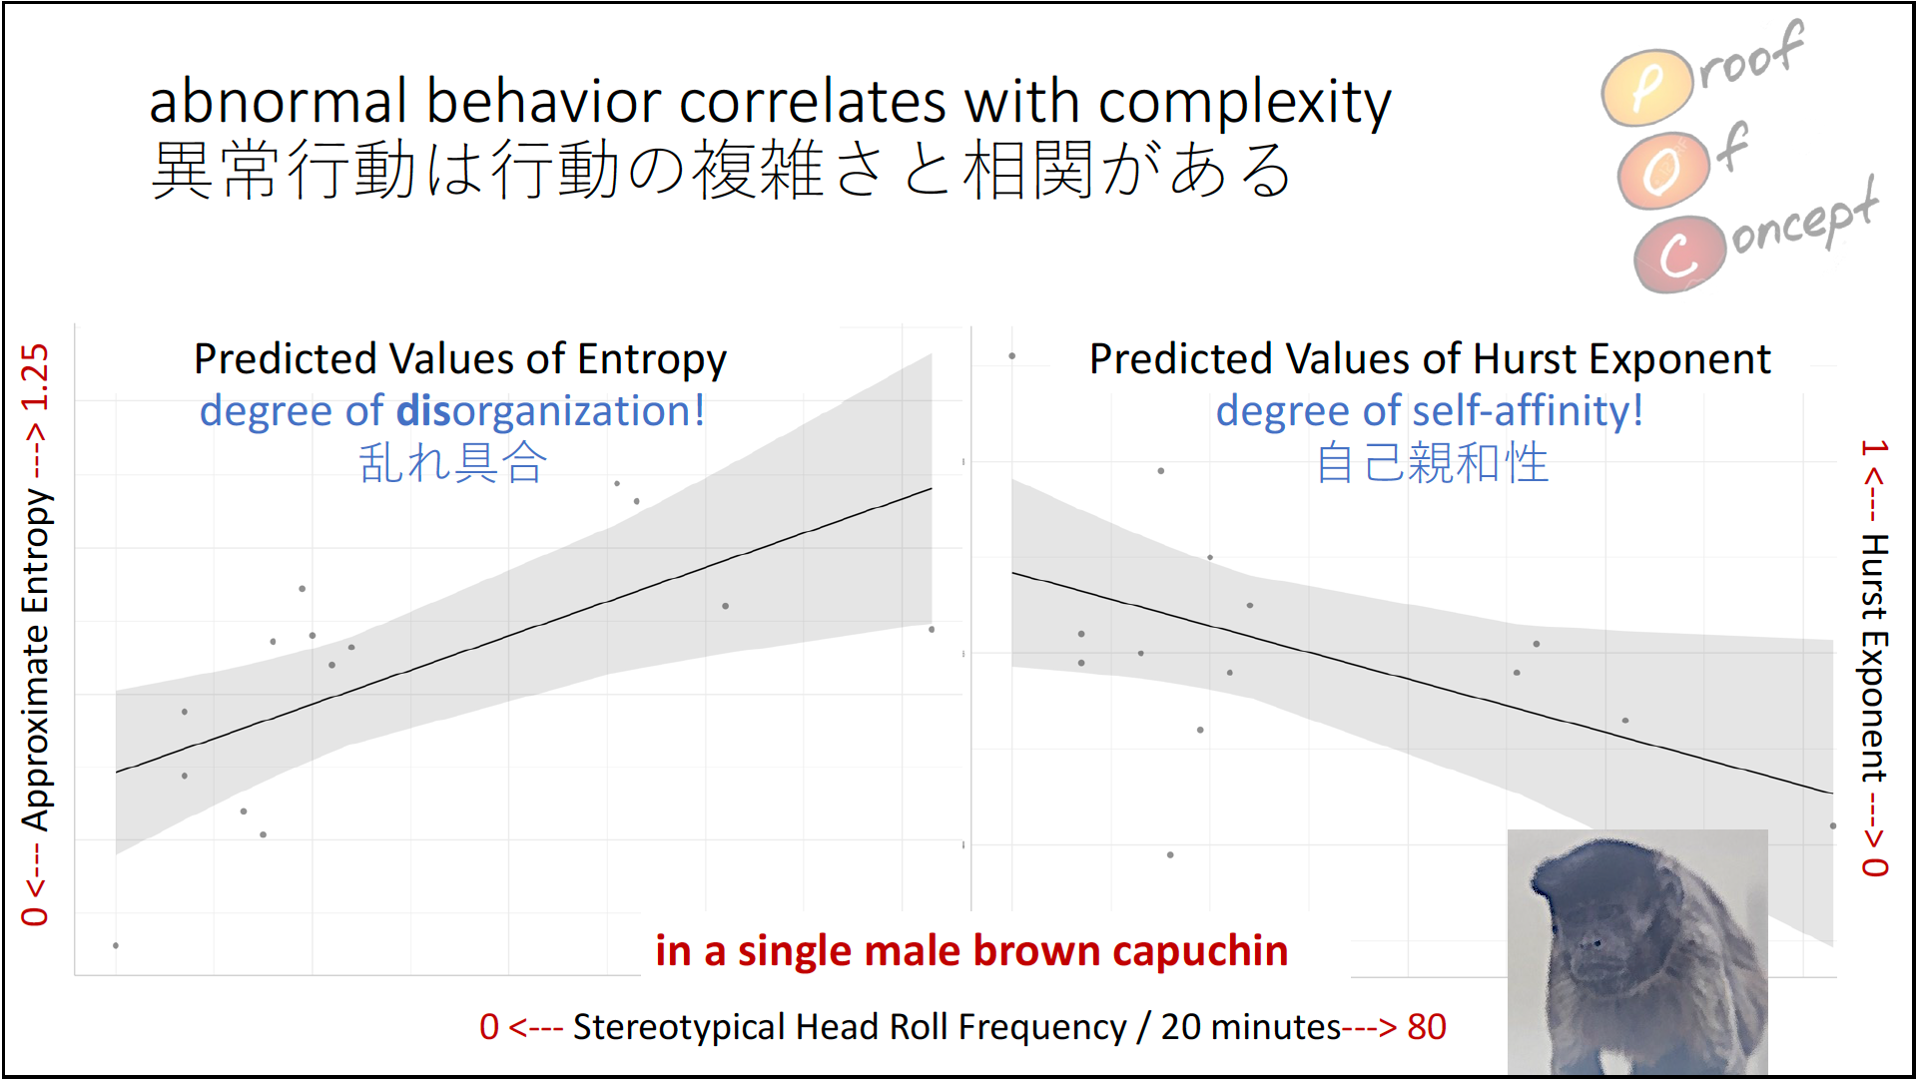
By the way, that’s Kanta there are the bottom of the above slide.
And just for good measure, here’s a plot of the entropy values against the Hurst values.
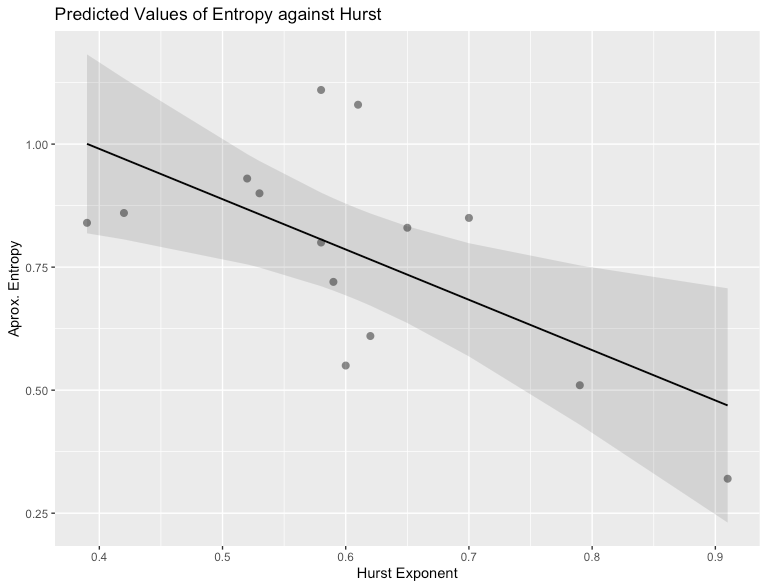
For these analyses as well, I used the R package nonlinearTseries. Plots were constructed using the plot_model() function in sjPlot.
We’ll need to go through much more data than is presently available, including for all the other animals in the data set (there are 7 capuchins in all at Kyoto City Zoo), but the above gets us off to an intriguing start to the project!
Stay tuned…